Airflow Support - Tips and tricks
This is here to help you get to the bottom of what’s wrong in any given Airflow Support Issue. This will take you through what information you need from the customer, what information you need to gather behind the scenes yourself, to know how to help any given customer.
Notice: Analytical Platform are releasing a new interface to Airflow (making use of Dagster) that adds a layer of abstraction for workflow definitions. This will allow users to provide a minimal set of information that gets converted into DAGs. This guide was originally written prior to the release of this new interface, and should be updated as troubleshooting trends emerge.
Table of Contents
Flow Chart
The following flow chart details how we generally approach a support issue that comes in for Airflow.
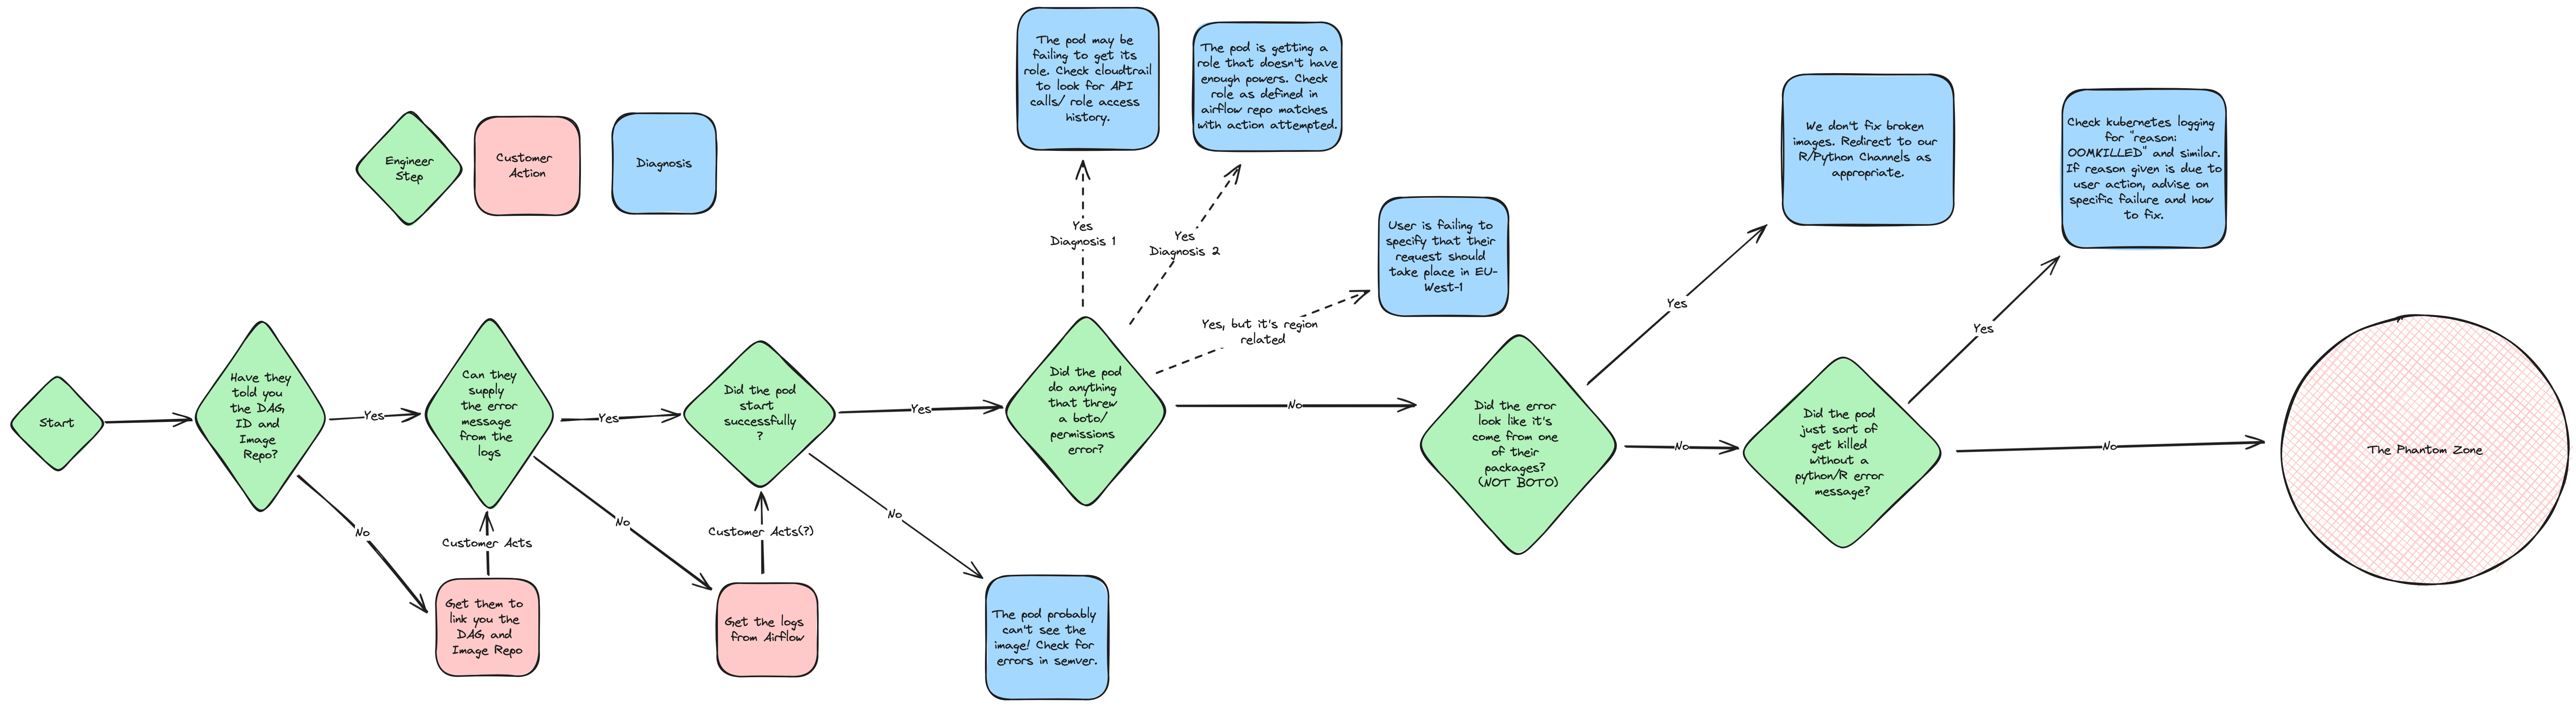
This is a wide image, so you may benefit from opening it in a separate tab where you can zoom in and work through it as you approach the ticket if you have difficulty reading it.
Step by Step Flow
1. Getting the DAG details and Image Repo
This information is foundational to our ability to diganose what is wrong. The DAG will be stored in the Airflow Repo, which is split into dev and prod environments. Each DAG will name a role (which can be found in the roles folder in each environment), and an image repo which will be held in a separate git repo. The key checklist to make sure the issue has provided is:
- A link to the DAG code in the Airflow Repo
- A link to the file that defines the role their DAG uses
- A link to the repository they publish the image this DAG uses from.
If the user has failed to provide any of the above, you should request them to provide the relevant bits of missing info to assist in your diagnosis.
2. Log Gathering
Having idenified the DAG in question, we now need to understand the nature of the failure. The best place to start are the logs that the pod generated while failing. In many cases, the customer will have already provided these. If they have not, you should ask them for the log dump from a recent failed run, or you can log into the Managed Workflows for Apache Airflow section of the AWS console, log into airflow-dev or airflow-prod (as is appropriate), and find the logs yourself from the information you’ve already gathered. This can be done by navigating to the airflow UI, and selecting the DAG for which you are seeking the logs. This will get you a page similar to the one below, which has been redacted for security.
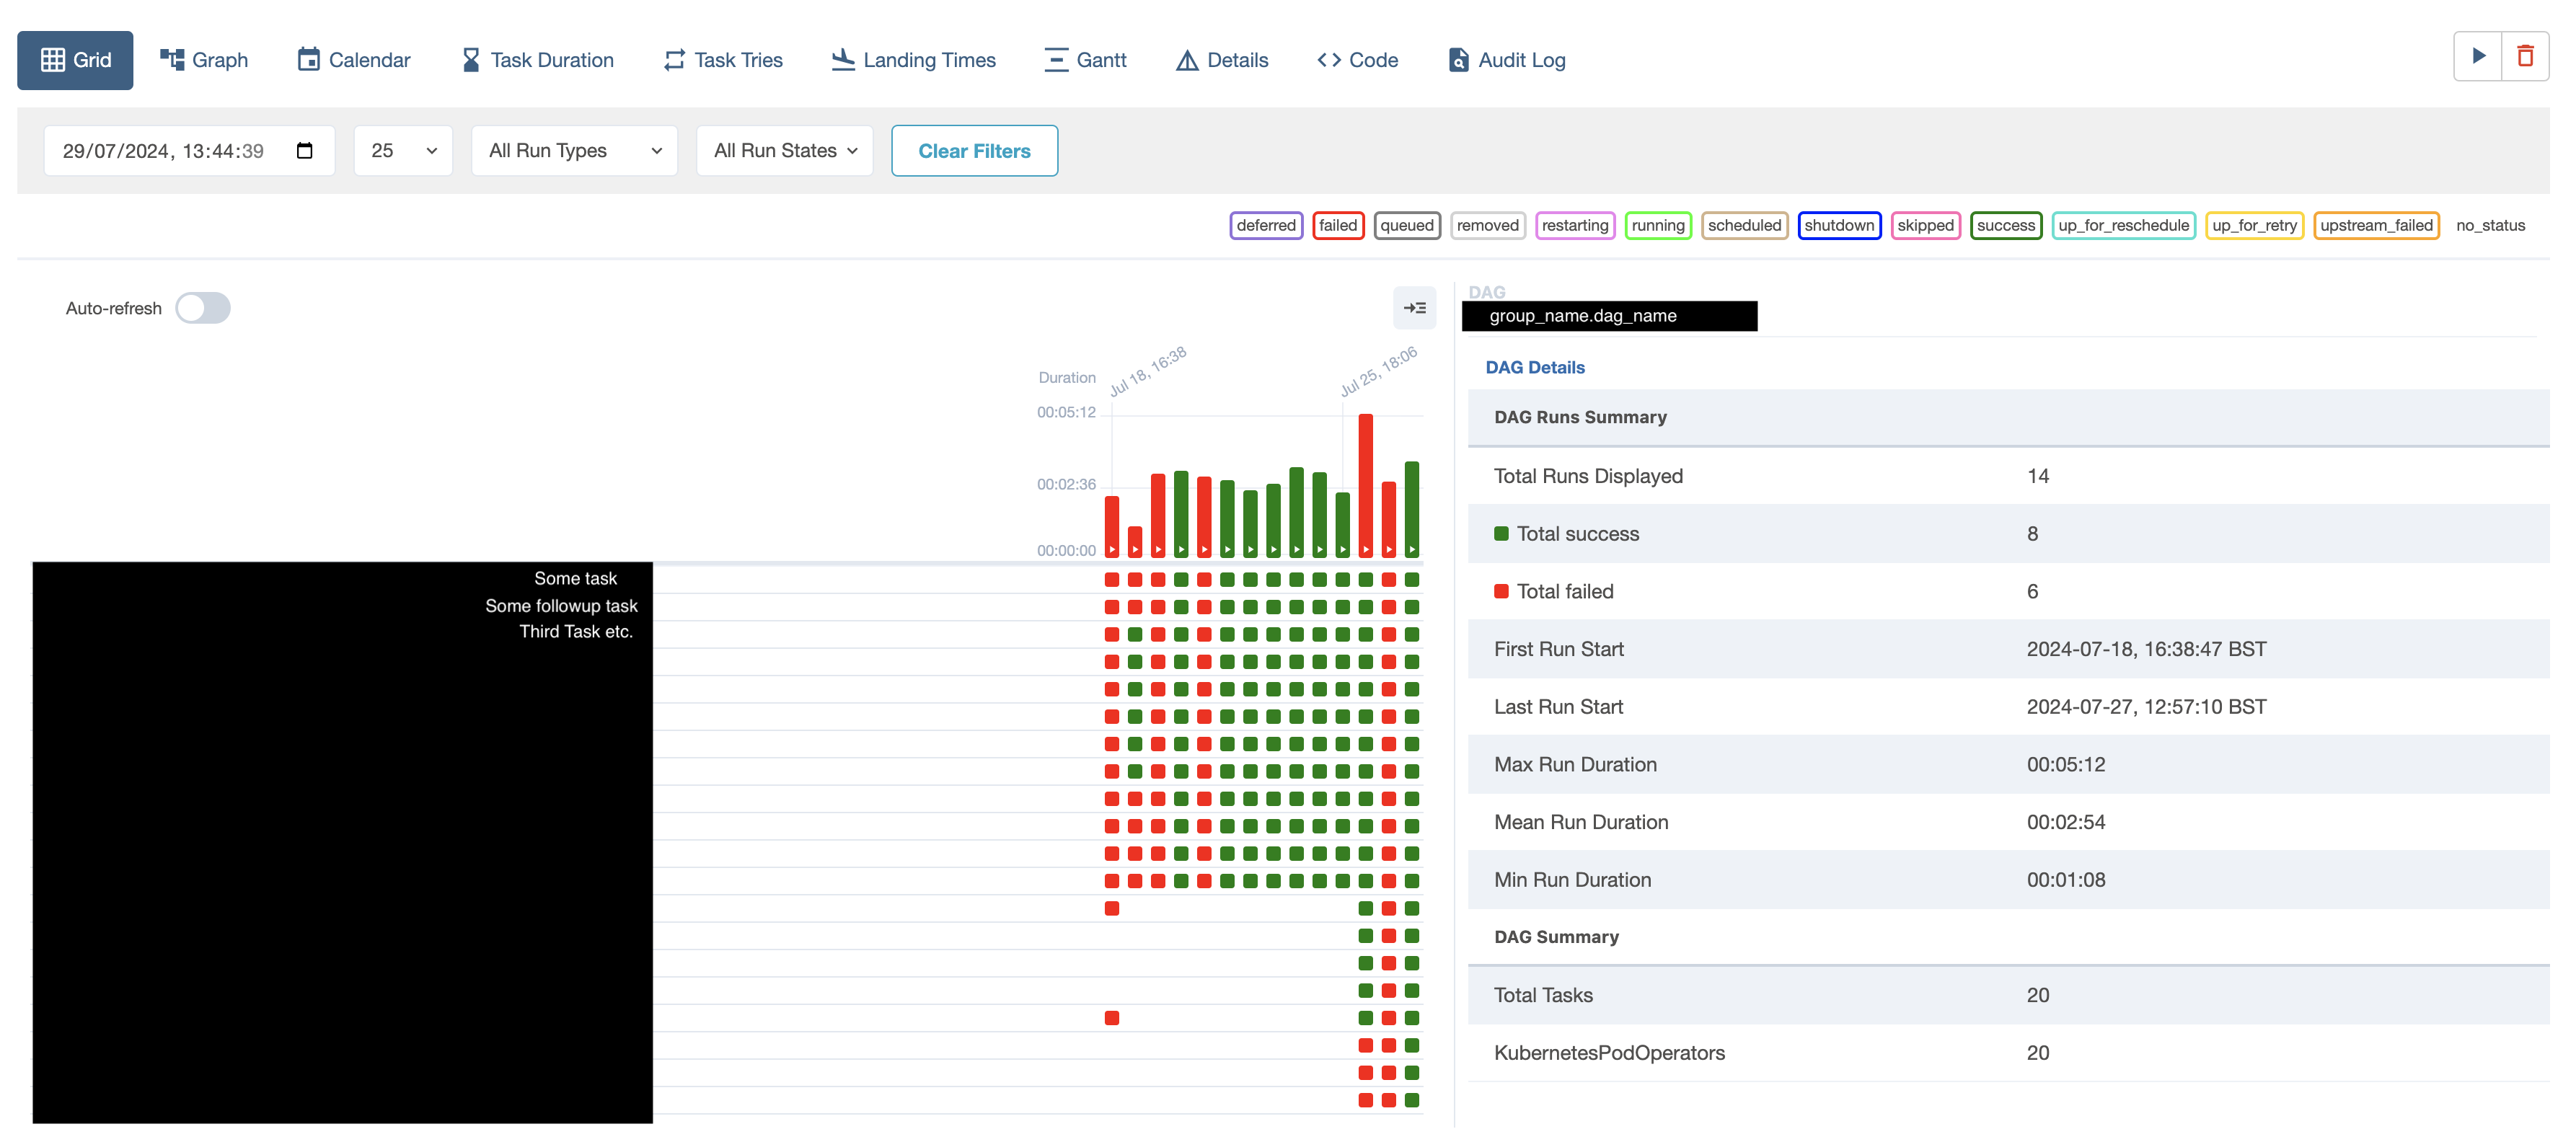
In this view, the large bars represent the overall status of the DAG - did all tasks pass, and how long did the tasks take overall. Each indivdual square beneath the bar chart represents the individual tasks of that run. Their colour indicates their current status (passed, failed, running, etc.) clicking on one of these squares will lead you to the log for that specific task/run combo. Ensure you have access to the logs before moving on, as these will be critical to our ability to diagnose the issue. Please note, that due to the large amount of logs this service generates, logs are quickly shifted to slower storage. Any logs older than approx 24 hours will take some time (up to 2-3 minutes in the worst case) to load. Please be patient, and they will load eventually! Sometimes, if a log is taking overly long, you may want to go into the airflow-<env>-logs log group in CloudWatch, and search for the log by name. It will always start with dag_id=name_of_group.dag_name/run_id=manual_20XX_0X_0X - you can cross reference the run type (manual vs scheduled) and the timestamp to ensure you’ve located the right log. These will sometimes load faster than retrieving the logs through the UI, particularly for older logs.
3. Analysing the log - pod startup
Now you have the logs, the first thing to check is whether the image booted successfully. Below is a (condensed) example of a standard airflow job log:
ip-XX-XXX-XX-XXX.eu-west-1.compute.internal
*** Reading remote log from Cloudwatch log_group: airflow-prod-Task log_stream: dag_id=some_example_dag/run_id=scheduled__2024-07-27T20_00_00+00_00/task_id=some_example_task/attempt=1.log.
[2024-07-28, 21:00:08 BST] {{taskinstance.py:1165}} INFO - Dependencies all met for <TaskInstance: some_example_dag.some_example_task scheduled__2024-07-27T20:00:00+00:00 [queued]>
[2024-07-28, 21:00:08 BST] {{taskinstance.py:1165}} INFO - Dependencies all met for <TaskInstance: some_example_dag.some_example_task scheduled__2024-07-27T20:00:00+00:00 [queued]>
[2024-07-28, 21:00:08 BST] {{taskinstance.py:1362}} INFO -
--------------------------------------------------------------------------------
[2024-07-28, 21:00:08 BST] {{taskinstance.py:1363}} INFO - Starting attempt 1 of 1
[2024-07-28, 21:00:08 BST] {{taskinstance.py:1364}} INFO -
--------------------------------------------------------------------------------
[2024-07-28, 21:00:08 BST] {{taskinstance.py:1383}} INFO - Executing <Task(KubernetesPodOperator): some_example_task> on 2024-07-27 20:00:00+00:00
[2024-07-28, 21:00:08 BST] {{standard_task_runner.py:55}} INFO - Started process 4188 to run task
[2024-07-28, 21:00:08 BST] {{standard_task_runner.py:82}} INFO - Running: ['airflow', 'tasks', 'run', 'some_example_dag', 'some_example_task', 'scheduled__2024-07-27T20:00:00+00:00', '--job-id', '300871', '--raw', '--subdir', 'DAGS_FOLDER/team_name/task_name.py', '--cfg-path', '/tmp/tmpm5b8dm_q']
[2024-07-28, 21:00:08 BST] {{standard_task_runner.py:83}} INFO - Job 300871: Subtask some_example_task
[2024-07-28, 21:00:09 BST] {{task_command.py:376}} INFO - Running <TaskInstance: some_example_dag.some_example_task scheduled__2024-07-27T20:00:00+00:00 [running]> on host ip-10-201-20-179.eu-west-1.compute.internal
[2024-07-28, 21:00:09 BST] {{taskinstance.py:1590}} INFO - Exporting the following env vars:
AIRFLOW_CTX_DAG_EMAIL=example@justice.gov.uk
AIRFLOW_CTX_DAG_OWNER=example
AIRFLOW_CTX_DAG_ID=some_example_dag
AIRFLOW_CTX_TASK_ID=some_example_task
AIRFLOW_CTX_EXECUTION_DATE=2024-07-27T20:00:00+00:00
AIRFLOW_CTX_TRY_NUMBER=1
AIRFLOW_CTX_DAG_RUN_ID=scheduled__2024-07-27T20:00:00+00:00
[2024-07-28, 21:00:09 BST] {{kubernetes_pod.py:587}} INFO - Creating pod some_example_task-28429696e6914baba536dd474ffd33c1 with labels: {'dag_id': 'some_example_dag', 'task_id': 'some_example_task', 'run_id': 'scheduled__2024-07-27T2000000000-a60a933d6', 'kubernetes_pod_operator': 'True', 'try_number': '1'}
[2024-07-28, 21:00:11 BST] {{kubernetes_pod.py:380}} INFO - Found matching pod some_example_task-28429696e6914baba536dd474ffd33c1 with labels {'airflow_kpo_in_cluster': 'False', 'airflow_version': '2.4.3', 'app': 'some_example_dag', 'dag_id': 'some_example_dag', 'kubernetes_pod_operator': 'True', 'run_id': 'scheduled__2024-07-27T2000000000-a60a933d6', 'task_id': 'some_example_task', 'try_number': '1'}
[2024-07-28, 21:00:11 BST] {{kubernetes_pod.py:381}} INFO - `try_number` of task_instance: 1
[2024-07-28, 21:00:11 BST] {{kubernetes_pod.py:382}} INFO - `try_number` of pod: 1
[2024-07-28, 21:00:11 BST] {{pod_manager.py:180}} WARNING - Pod not yet started: some_example_task-28429696e6914baba536dd474ffd33c1
[2024-07-28, 21:00:12 BST] {{pod_manager.py:180}} WARNING - Pod not yet started: some_example_task-28429696e6914baba536dd474ffd33c1
[2024-07-28, 21:00:13 BST] {{pod_manager.py:180}} WARNING - Pod not yet started: some_example_task-28429696e6914baba536dd474ffd33c1
...
This is intimidating, but already gives us clues - the back end of the task gives us a number of warnings about the pod not yet having started. If the pod is able to start, you’ll these warnings give way to any log info the pod is generating. However, in some cases, this step will just continue indefinitely, and not give way to the job itself. This will manifest as an error like:
[2024-07-16, 12:03:51 BST] {{pod_manager.py:180}} WARNING - Pod not yet started: some_example_task-28429696e6914baba536dd474ffd33c1
[2024-07-16, 12:03:52 BST] {{pod_manager.py:180}} WARNING - Pod not yet started: some_example_task-28429696e6914baba536dd474ffd33c1
[2024-07-16, 12:03:53 BST] {{pod_manager.py:180}} WARNING - Pod not yet started: some_example_task-28429696e6914baba536dd474ffd33c1
[2024-07-16, 12:03:53 BST] {{kubernetes_pod.py:475}} INFO - Deleting pod: some_example_task-28429696e6914baba536dd474ffd33c1
[2024-07-16, 12:03:53 BST] {{taskinstance.py:1851}} ERROR - Task failed with exception
99% of the time, when this occurs, it is due to the pod being unable to find the image it is trying to load. This happens for 2 reasons:
- Users have published the image with a name (usually specifically the tag) that doesn’t match the name their DAG is looking for.
- Users are working with an image that hasn’t been updated in a long time, and thus has not been updated to let our newer compute cluster activate it.
Luckily for us, the solution is essentially the same in both cases. Look through their DAG code - in the opening few lines should be a reference to some combination of REPO_NAME=, IMAGE_TAG= and/or IMAGE= as a way of specifying their desired image. When you visit the image repo that they’ve shared with you, you can go to the ‘releases’ section of the github page to check the image tags they’ve released under. The most common form of this error is a dag specifying an IMAGE_TAG=v0.0.X, and then a github release under the tag v.0.0.X. The extra . in the later example will lead to the image failing to be retrieved, and the above error occuring. Less common, but also possible, are typos in the IMAGE= or REPO_NAME= arguments where used. Given the path to the image must be exact, any of these being wrong can lead to this error.
To Resolve:
Ask the user to either update their IMAGE_TAG, REPO_NAME or IMAGE arguements as appropriate via raising a PR in the Airflow repo. Once this update has been merged, it will be reflected within Airflow within 2 minutes or so, at which point the user can test and confirm they’re able to run their job.
4. Boto(core) and its many errors
Assuming the pod was able to retrieve the image, it will then boot and start running some analytical code in R or Python. This means we are now in the realm of user-defined code, meaning fixes are largely on the user to carry out. However, the core of how most of these tasks carry out their work is via interacting with our AWS estate, and thus via Boto3/Botocore/AWSWrangler and other related packages for working AWS APIs. Where the error the pod throws mentions one of these by name, the error it throws will usually help you understand what might be required to fix it. Some examples of botocore errors include:
Cross-region errors:
botocore.errorfactory.InvalidRequestException: An error occurred (InvalidRequestException) when calling the StartQueryExecution operation: The S3 location provided to save your query results is invalid. Please check your S3 location is correct and is in the same region and try again. If you continue to see the issue, contact customer support for further assistance.
botocore.exceptions.ClientError: An error occurred (AccessDenied) when calling the CopyObject operation: VPC endpoints do not support cross-region requests
Access Denied Errors:
botocore.exceptions.ClientError: An error occurred (AccessDenied) when calling the CopyObject operation: No identity-based policy allows the S3:CopyObject action
Broadly, however, these share a common quality - they’re all permissions-based errors. As such, they tend to fall neatly into one of three categories:
1. Access Denied - Failed to assume role entirely
When a pod spins up, it is given an AWS role, either via kube2iam, or IRSA. In either case, this role it is given is what empowers it to do anything within the AWS estate. For the role named in the Airflow DAG, you can check the last time it was accessed via the AWS console by searching for the role by name under Roles in IAM, then looking on the Access Advisor tab to see when each permission set was last excersised. If the role was last accessed a week ago, and the pod ran today, then there’s a good chance the pod failed to get the role. These will always manifest in AccessDenied and similar errors, as the pods will be blocked from ALL AWS actions without access to a role.
To Resolve:
Check the role_name or service_account_name in the DAG definiton
matches with what the actual role being created for them is. Assuming it matches, then verify that their role exists in AWS and is not malformed (compare IAM role/access policy to known working examples). Beyond this, check it does not fall into any of the later categories, and then please refer to later in the guidance on advanced troubleshooting tips if you’re still having issues.
2. Access Denied - No Identity Based Role
In this case, we have been able to hand a role into the pod. However, at some point during its operations, the pod has run into an error of the form No Identity-Based Policy allows the service:SomeAction action. In this case, the user has tried to do something that is not specified in its role definition. As before, we can find all roles in the Airflow Repo, with a roles folder existing for each environment. In the error message, it will specify the specific action that the user has tried to do that they lack the permission for.
To Resolve:
Ask the user to modify their role.yml file to add the permissions they are missing, and to have a data-engineer review the changes. If the permission is for a service we do not currently support, such as textract, then ask them to raise a feature request that we add support for it, and advise them we will be unable to support said workload until we can add said support.
3. Access Denied - Region Looking things
This is the most subtle of these, as it can look like the pod is doing all the right stuff: It’ll get a role, potentitally even carry out a bunch of actions it seems to have permissions for, and then suddenly error out doing something innocuous like an athena query with an access denied error.
The best starting point for diagnosing these is AWS CloudTrail. This logs all API call interactions across our AWS accounts, but in this case analytical-platform-data-production will be where all Airflow-based calls go to. CloudTrail logs are region specific, and as such we will want to start our diagnosis in eu-west-1. From the CloudTrail landing page, select Event History from the tabs on the right.
Important Note: If this is your first time using CloudTrail to diagnose issues, I would highly recommend enabling the Error code column. To do so, select the small cog icon near the top right of the Event History panel. This will open a dialogue that will allow you to toggle which columns are displayed. Ensure that at least the Event name, User name, Event time and Error code columns are enabled.
When viewing the event history, we are seeing all API calls in all accounts. As such, we want to filter our history to only cover the time the error code occured. Thankfully, Airflow’s timezone is set to match AWS, so we can use the timestamps in the Airflow task logs to target when to view. Using the filter by date and time field at the top of Event History, use the Absolute Range feature, setting the start time to a minute or two before the timestamp of the error, and setting the end time to 5-10 mins after. This tends to strike a good balance between ensuring the failure is captured in the Cloudtrail logs, and not overwhelming you with pages and pages of events to trawl through to find the relevant one. You should see all events from the window, including hopefully those involving a User name that matches your airflow role’s name.
To Resolve:
Begin your search in eu-west-1, as previously mentioned. If you can see the API calls, use the error codes to determine whether the role has sufficient permissions, and advise them as above if not. If the calls cannot be seen in eu-west-1, the next step is to look in eu-west-2 - since the recent APC migration of airflow workloads, some jobs that weren’t specifying their region are having their requests take place in eu-west-2 as this is the new home for the compute. This will cause access denied errors, as most of our buckets are in eu-west-1. Ask them to modify their image so that any copy/query operations specify the region they want these operations to occur in. If their API calls don’t show up in eu-west-1 or eu-west-2, then as a last resort check us-east-1, as this is the default region for all IAM operations, so if the role has in some way got into a fallback state it could end up there. In these instances, consult with AP team on solution, as some non-standard behaviour is occuring.
If the error seen doesn’t fall into any of the above, it may be a package error (see next section), otherwise refer to the advanced troubleshooting tips.
5. Package Related Errors
Our users run a bunch of R and Python based code that at the end of the day they are responsible for. Airflow logs are very intimidating to read for the average user, so sometimes support issues will arrive at our door related to this code regardless. These will exhibit as support issues where the job has ‘failed’, but the user doesn’t specify how. If you are lucky, they will have dumped the full log content already, if not you will have already asked for it by now. In the logs, you will see something referencing a traceback for python code, and either a traceback or debug output for R code. Using cmd + f to find these in the logs, these outputs will name the exact package(s) that threw the errors.
To Resolve:
Point the user to the relevant section of the log, and ask them to modify their image to resolve the error listed. AP Team is not a resource to debug user code, so you should politely decline if asked to do so. If the user identifies that the error had not been occuring until recently, check for changes to the image in the recent history for the DAG. If there’s any changes to image_tag, suggest reverting the image. If there have been no clear changes to the dag and it’s suddenly developed package failures, raise with the rest of the AP team for further guidance.
6. The pod just kinda died
Assuming none of the above steps have helped, the next most common option is a pod that just spins up, gets its image fine, trundles away for a bit and then just dies part way through the job with no Python or R looking warnings. If you’re lucky, the user will have implemented logging functionality within their image to update on what actions the image was taking immediately before it died. Telltale signs of this (other than what we’ll talk about in a moment) are logs that refer to loading new files, or trying to do data linking operations, immediately followed by a sudden pod death.
However, this is all beating around the bush - If the pod is killed early, then as as well as the pod logs the log will contain a full description of the pod at the point in time that it was killed. This, helpfully for us, will also contain at various points a reason: argument, that will give us our likely culprit - OOMKilled. This is short for Out of Memory - Killed, and means the pod tried to do an operation while running that would have required more RAM than the pod has available, and as such as been pre-emptively and brutally killed by the cluster for the stability of all other jobs (we thank you for your sacrifice o7 ).
To Resolve:
Once you have verified the existence of reason: OOMKilled in the log file, ask the user to look at ways they could reduce the memory consumption of their job (unloading datasets that are not in active use, using memory efficient lazy load/read actions, etc.). Assuming they are unable to, advise them to use the high memory node by modifying their DAG in accordance with the user guidance.
Advanced Troubleshooting
Welcome to the area I colloquirally call the Phantom Zone. Much like the comic books, it’s a strange space that sits outside natural space or time. This mostly just means you’re seeing some really weird behaviour from your pods, and also occasionally General Zod. Examples include:
- Images that can’t be retrieved for no clear reason.
- Pods That won’t die (Zombie Pods!)
- Pods that refuse to output any useful logging
- CrashLoopBackoff Pods
- Kyverno Issues
Your first step here is to authenticate with the cluster - the Analytical Platform dev container has all our cluster contexts pre-programmed. The relevant ones (for now) are airflow-dev, airflow-prod, analytical-platform-compute-test, and analytical-platform-compute-production. Select the one the job is running on, and uncomment it out. Ensure you have aws-vault-ed in, and then you should be ready to work with the cluster:
kubectl get pods -n airflow
Will display all currently running airflow pods in the environment. You may wish to use
kubectl get pods -A
so that you can see the status of other cluster components (autoscaler, kyverno, etc.). If any are in states other than RUNNING, this is likely an indicator that something is not right. To audit the logs of an individual pod, you can run
kubectl get event -n airflow --field-selector involvedObject.name=<POD_NAME>
Where POD_NAME can be taken from either the airflow logs, or by finding the pod while it is running as above. If the pod has successfully loaded the image it’s using, you’ll see the following sequence of states:
scheduled → pulling → pulled → created → started
If you see anything but this, it means your pod failed during the start process. Common ways this can happen are:
Image pull failures - Make sure their build-and-push-to-ECR action is working correctly, and matches their DAG.
Scheduling issues - if a pod doesn’t have the correct taints/affinities this can cause the pod to never be assigned to a node. Make sure they’re properly importing either our standard taints and affinities, or our new
karpentercompute classesNetwork issues - Occasionally, if the node we’re on is being thrashed and is degraded in performance, we should be syphoned to a new one - however that can be problematic for any tasks still in progress on the old node. Usually fixed by just re-running.
If the pod looks like you’re booting into the image fine, and the logs have not given you anything useful for you diagnostically, then it’s time for us to move onto more advanced troubleshooting.
Non-Delete Operator Pod (and it’s cousin, the Zombie Pod)
If the pod is simply dying too quickly for you to diagnose it, you can force it to stay up by changing the definition of the DAG to include is_delete_operator_pod = 'false'. (Note: You will have to do this by downloading the python file and re-uploading the changed one to the bucket in S3, as the Airflow repo’s validation will reject non-delete pods.) Having done this, the pod will on it’s next run stay running after it is ‘done’. You can exec into the pod:
kubectl exec -i -t <container_name> -n airflow -- /bin/bash
This will get you into the bash terminal of the pods, and allow you to explore for things like crashlogs that might have been left on the pod after the task failed. Please make sure you delete the pod when it’s done with:
kubectl delete pod <container_name> -n airflow
This is also the solution to zombie pods, which are pods that occasionally get stuck shutting down. These aren’t an issue usually, as the node drains mean these are killed naturally, but should still be killed off when noticed. These will be pods with incredibly long durations stuck in a state other than RUNNING.
Logs stop, but the task runs to completion (benign zombie pods)
Sometimes a KubernetesPodOperator task will become decoupled from its MWAA worker. Airflow is no longer tracking the task, but it can continue to completion. This can present as a task that gets marked as Failed in the airflow UI, with logs abruptly stopping at some point, but the goes on to complete.
The pod logs and diagnostics can be found within the Observability Platform analytical-platform/compute/mwaa/workloads dashboard. Setting the environment variable to analytical-platform-compute-test will show task pods from Aiflow-Dev, and analytical-platform-compute-production will show task pods from Airflow-Prod. The pod ID can typically be found near the top of the Airflow task logs (from the airflow UI) after the task definition, as part of a log entry that starts like:
[2024-01-01, 00:00:01 UTC] {{kubernetes_pod.py:380}} INFO - Found matching pod
CrashLoopBackoff
These are broadly not our problem, as they usually indicate an issue with the image the pod is using. However, should this occur with one of the add-on pods (ClusterAutoScaler etc.), we should try and upgrade the version of the add-on ASAP.
Solving Kyverno Issues
If users show up at the channel with errors of the form
"message":"Internal error occurred: failed calling webhook \"validate.kyverno.svc-fail\":
failed to call webhook: Post \"ht tps://kyverno-svc.kyverno.svc:443/validate?timeout=10s\":
no endpoints available for service \"kyverno-svc\""
This means Kyverno has got itself into a state where it is blocking the cluster from making a node-group transition. It is not clear what causes this to happen, but our best guess is that if the old cluster begins shutting down before the new kyverno instance can start, we see this behaviour. To double check this, you can run
kubectl get pods -A
Doing so should list multiple pods in the kyverno namespace, at least one of which will be stuck TERMINATING
Fixing this is a PRIORITY, as it will block ALL airflow jobs. Thankfully, the fix is easy. Assuming you are connected to the cluster with Kubectl (as per above instructions), you can run:
kubectl delete validatingwebhookconfiguration kyverno-resource-validating-webhook-cfg
kubectl delete  mutatingwebhookconfiguration kyverno-resource-mutating-webhook-cfg
These two commands will cause kyverno to regenerate the two webhooks listed, hopefully unblocking the state.
Contact Information
The Analytical Platform team can be contacted by raising a support issue. If you’re reading this, you’re probably a team member though, so just ask someone in the slack channel for help if there’s an issue you get stuck on.