Analytical Platform Architectural Diagrams
These pages document the technical and logical architecture that makes up the Analytical Platform (AP).
To ease understanding and maintenance of these diagrams, we provide a number of diagrams at varying levels of detail. Higher level diagrams attempt to aid understanding of the platform as a whole, but omit engineering detail. Other, more detailed diagrams may document parts of the platform in more detail and omit high-level context.
These diagrams are not sacred objects - we encourage developers, engineers and others, if they feel comfortable, to submit updates and improvements. For more information see contributing and updating below.
High level diagrams
These two diagrams should be sufficient for anyone who is looking for a quick, high-level overview of the components which comprise the Analytical Platform. Below is an index of more detailed diagrams.
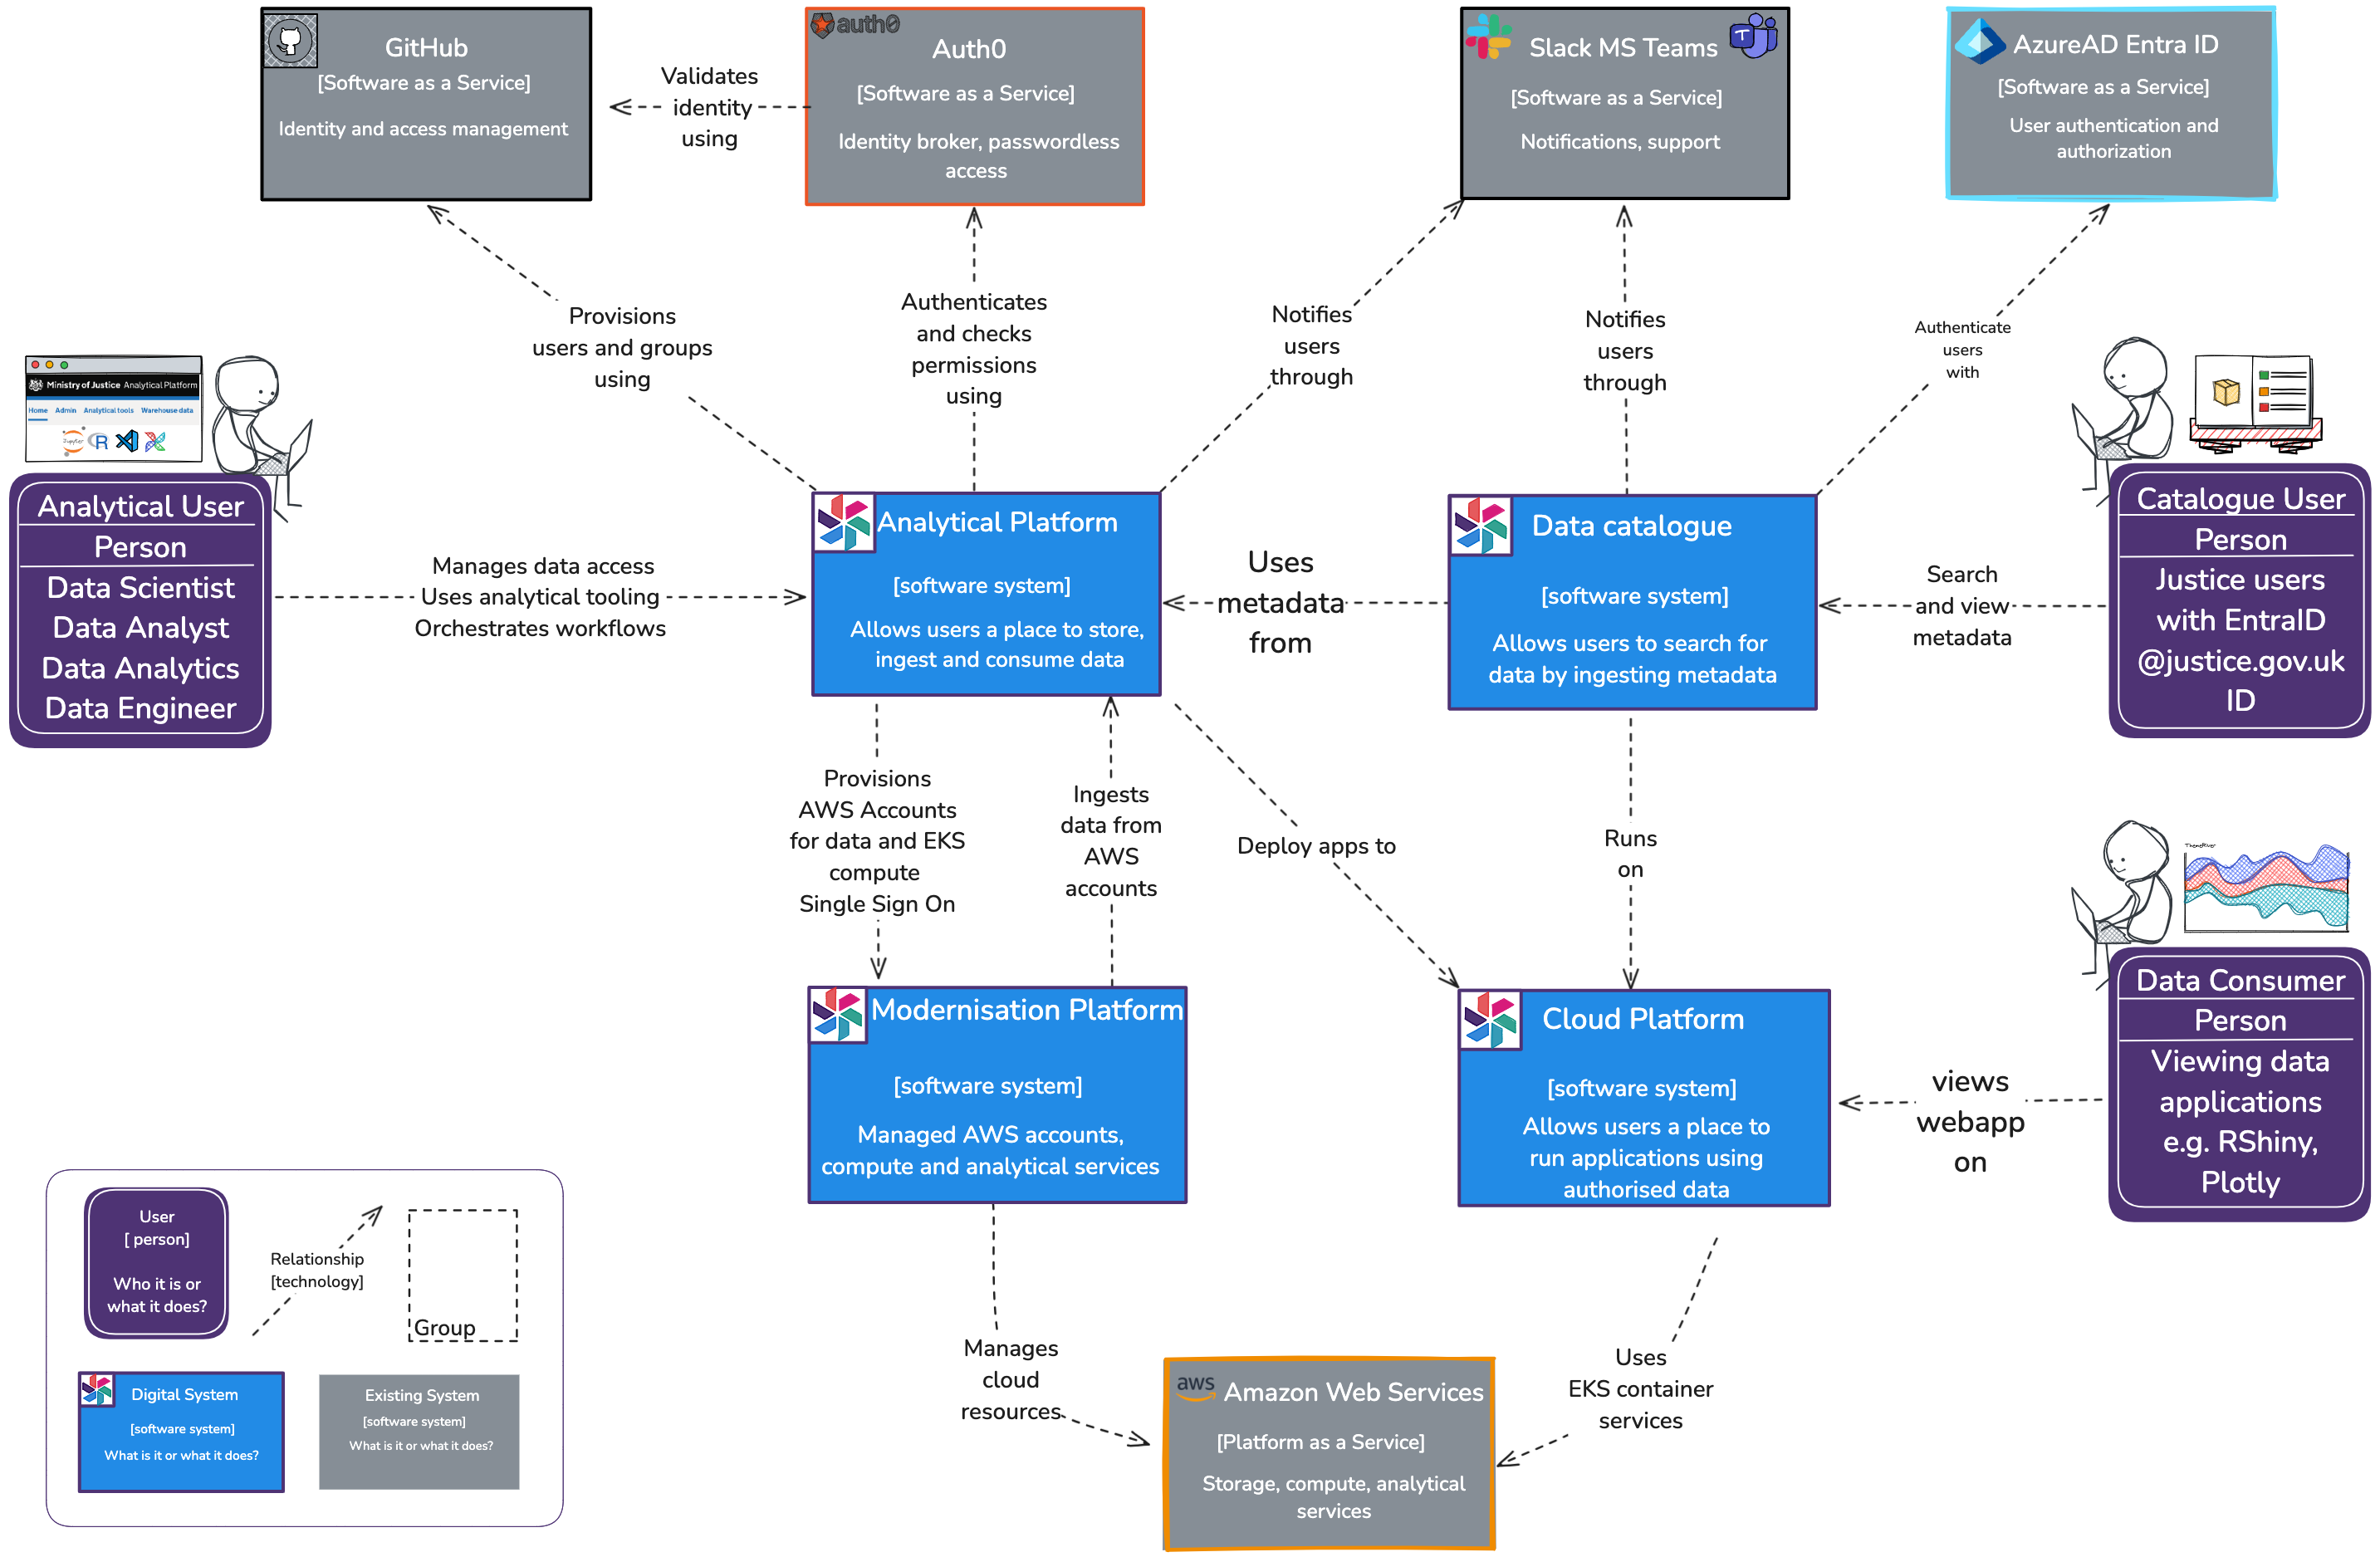
High level context (C4) diagram
This is the highest level of abstraction and provides an overview of the entire platform. It shows the system and its external dependencies, such as users, external systems, and APIs. The intended audience is everybody, both technical and non-technical.
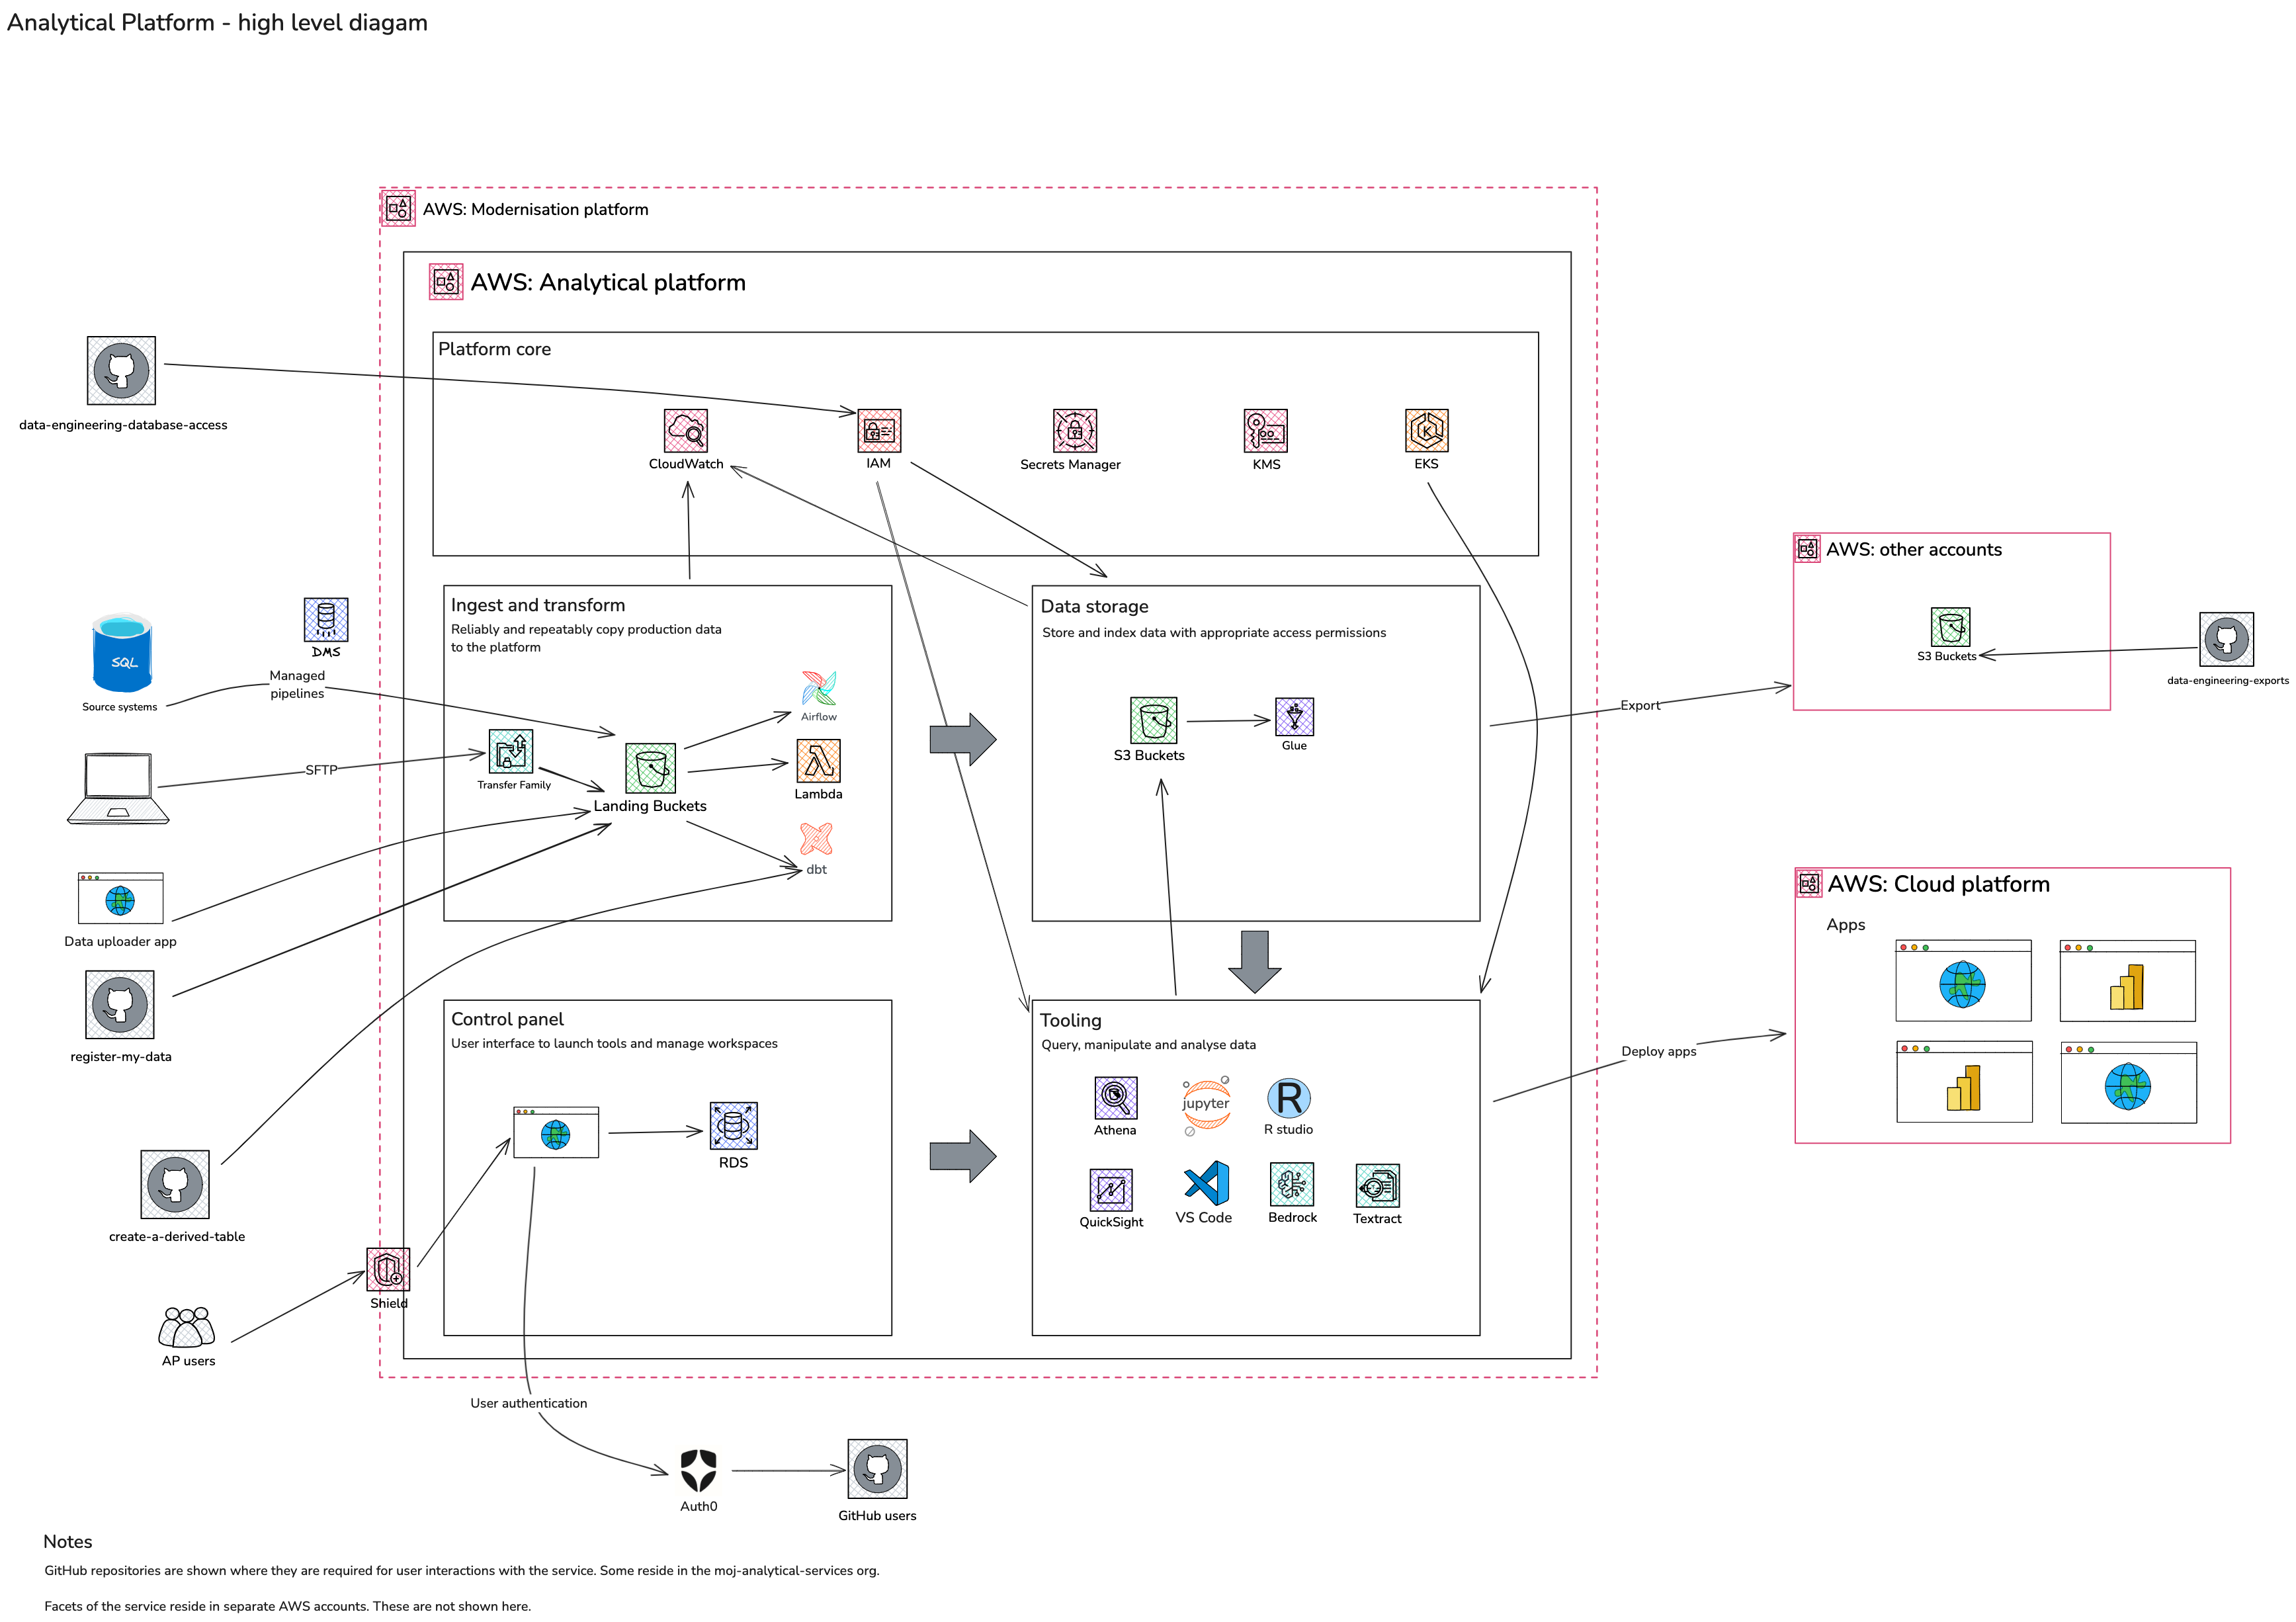
High level architecture
At a high level, the AP exposes services which enable users to:
- Upload or transfer data
- Store data
- Transform data
- Manage access to data
- Query and analyse data
- Disseminate analysis via apps
This diagram shows the logical components, and the AWS services used to deliver those services. Scroll down for more.
List of diagrams
- High level context (C4) diagrams. These represent and its external dependencies, such as users, external systems, and APIs. The intended audience is both technical and non-technical people.
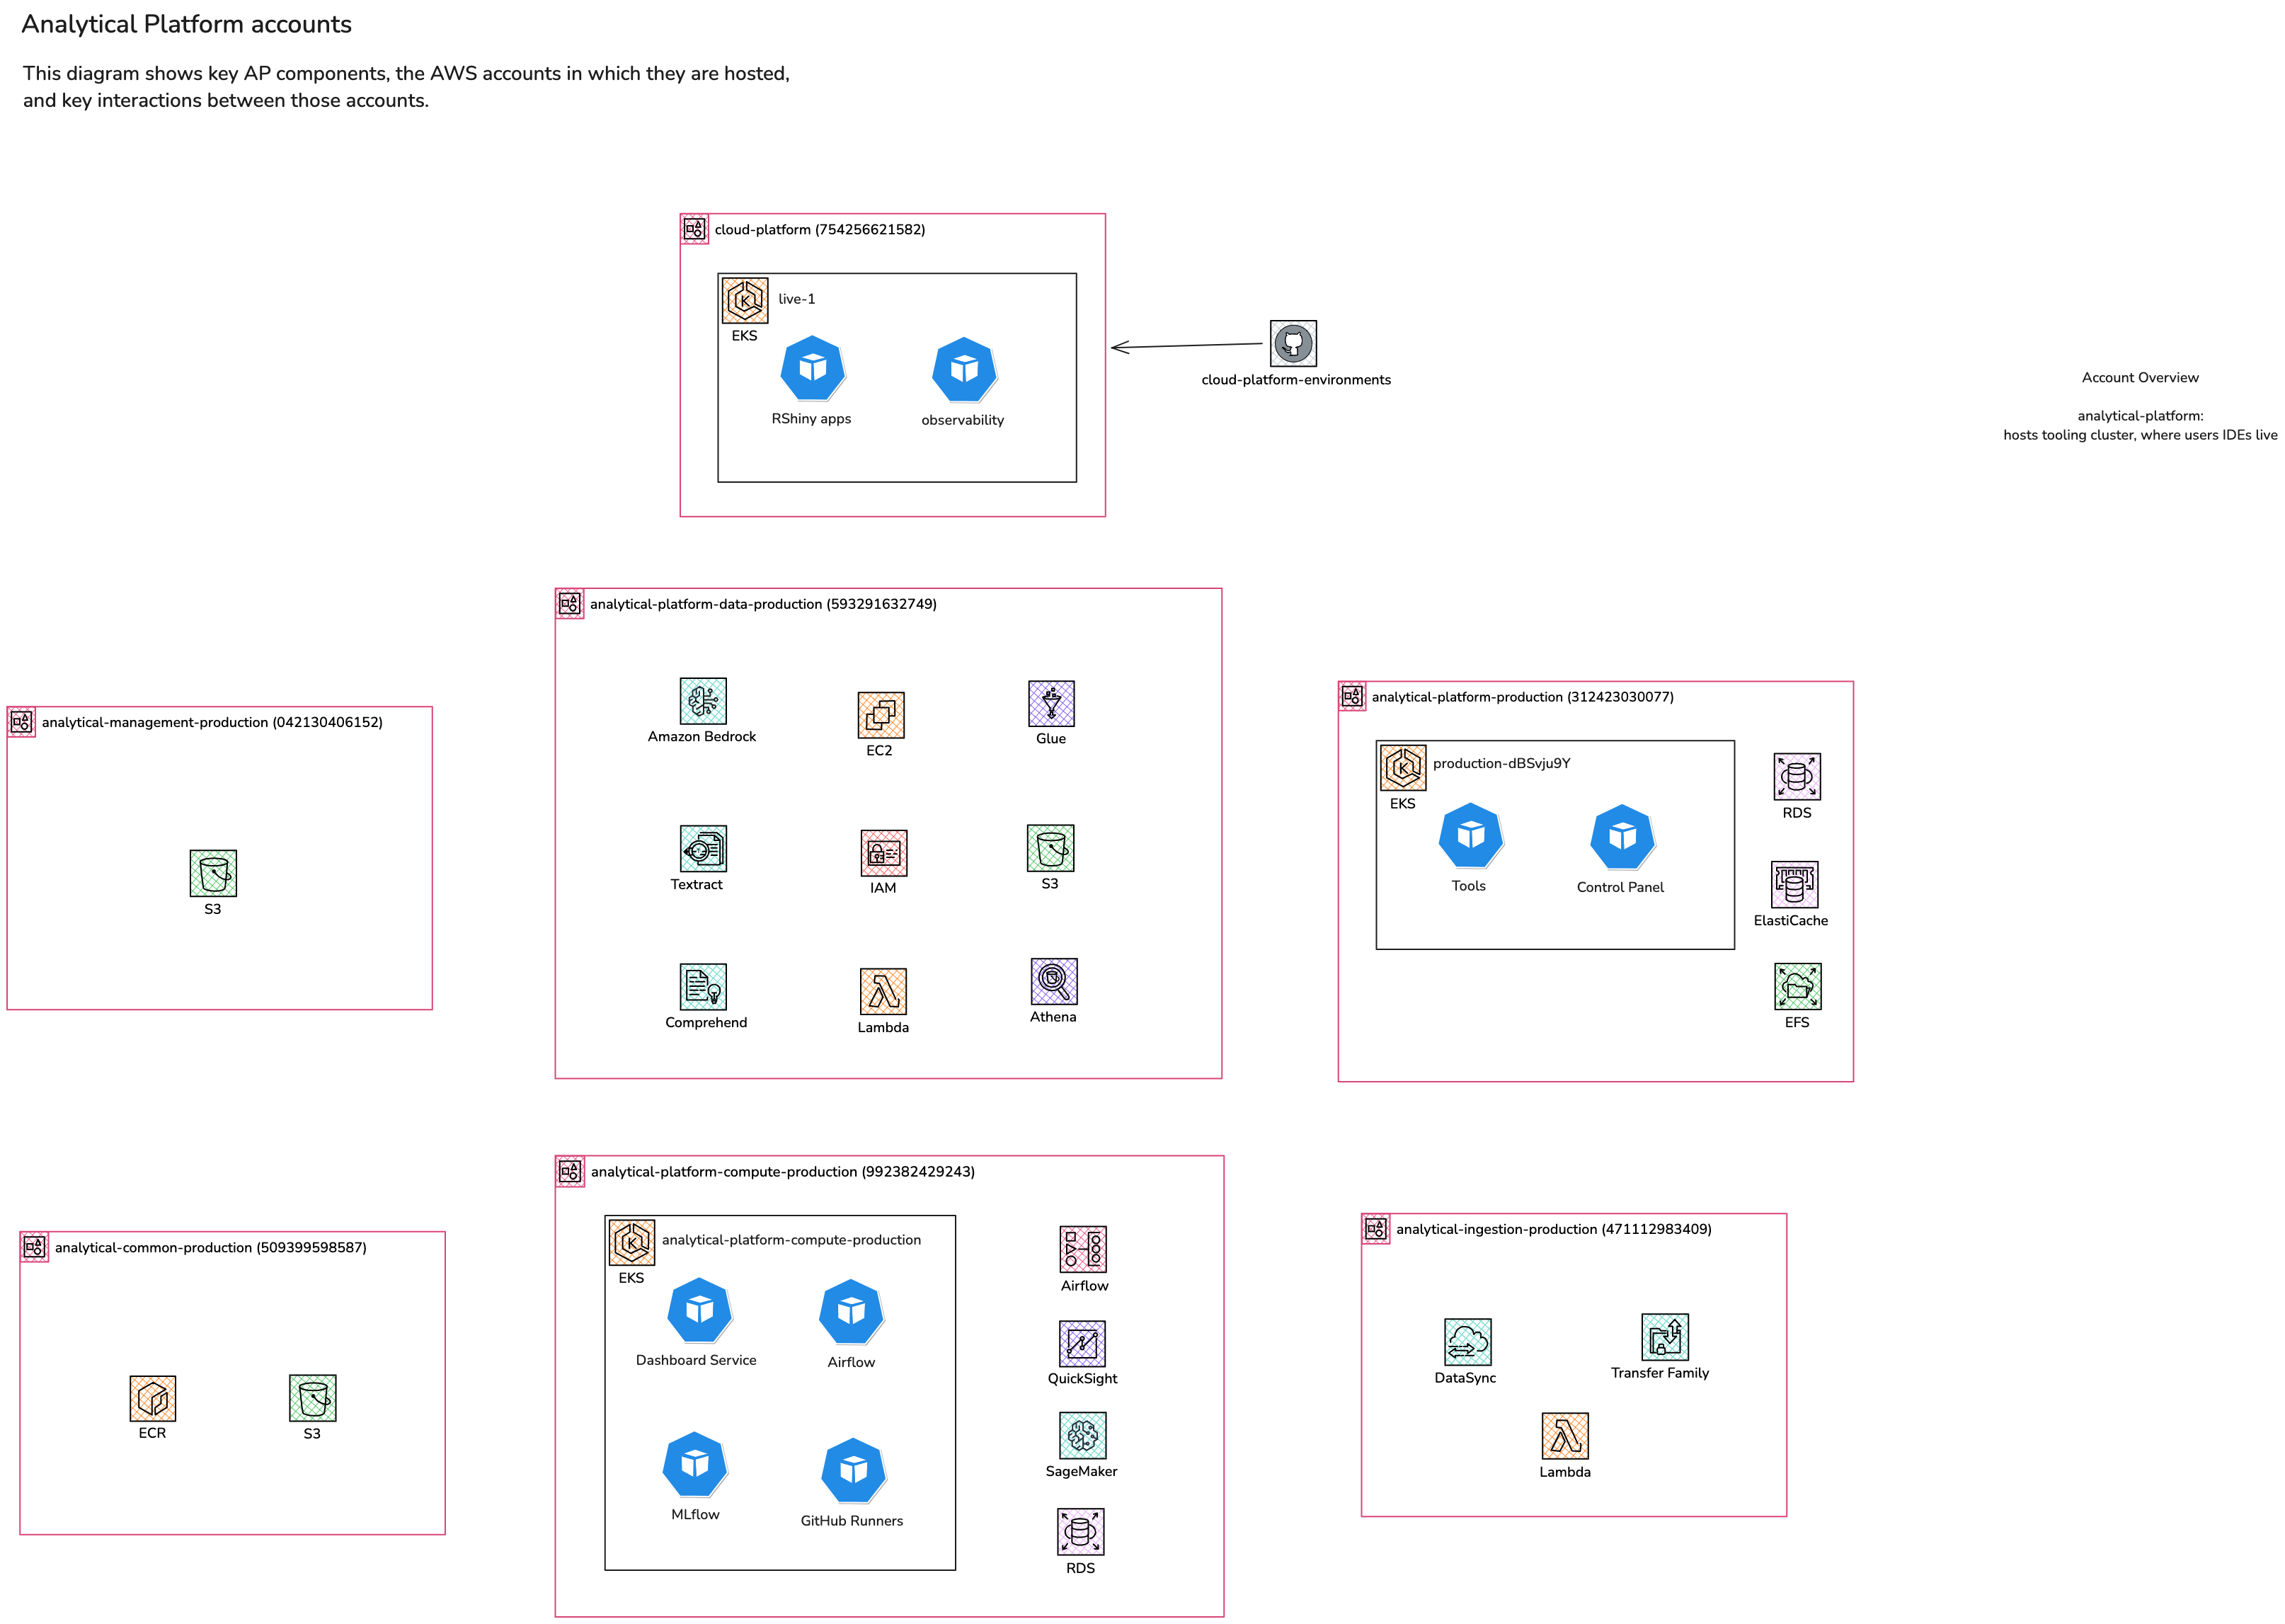
- AWS accounts diagram. Documents key AP components, the AWS accounts in which they are hosted, and key interactions between those and other key MOJ accounts and services. Please refer to this in conjuction with the AP data and compute accounts diagram.
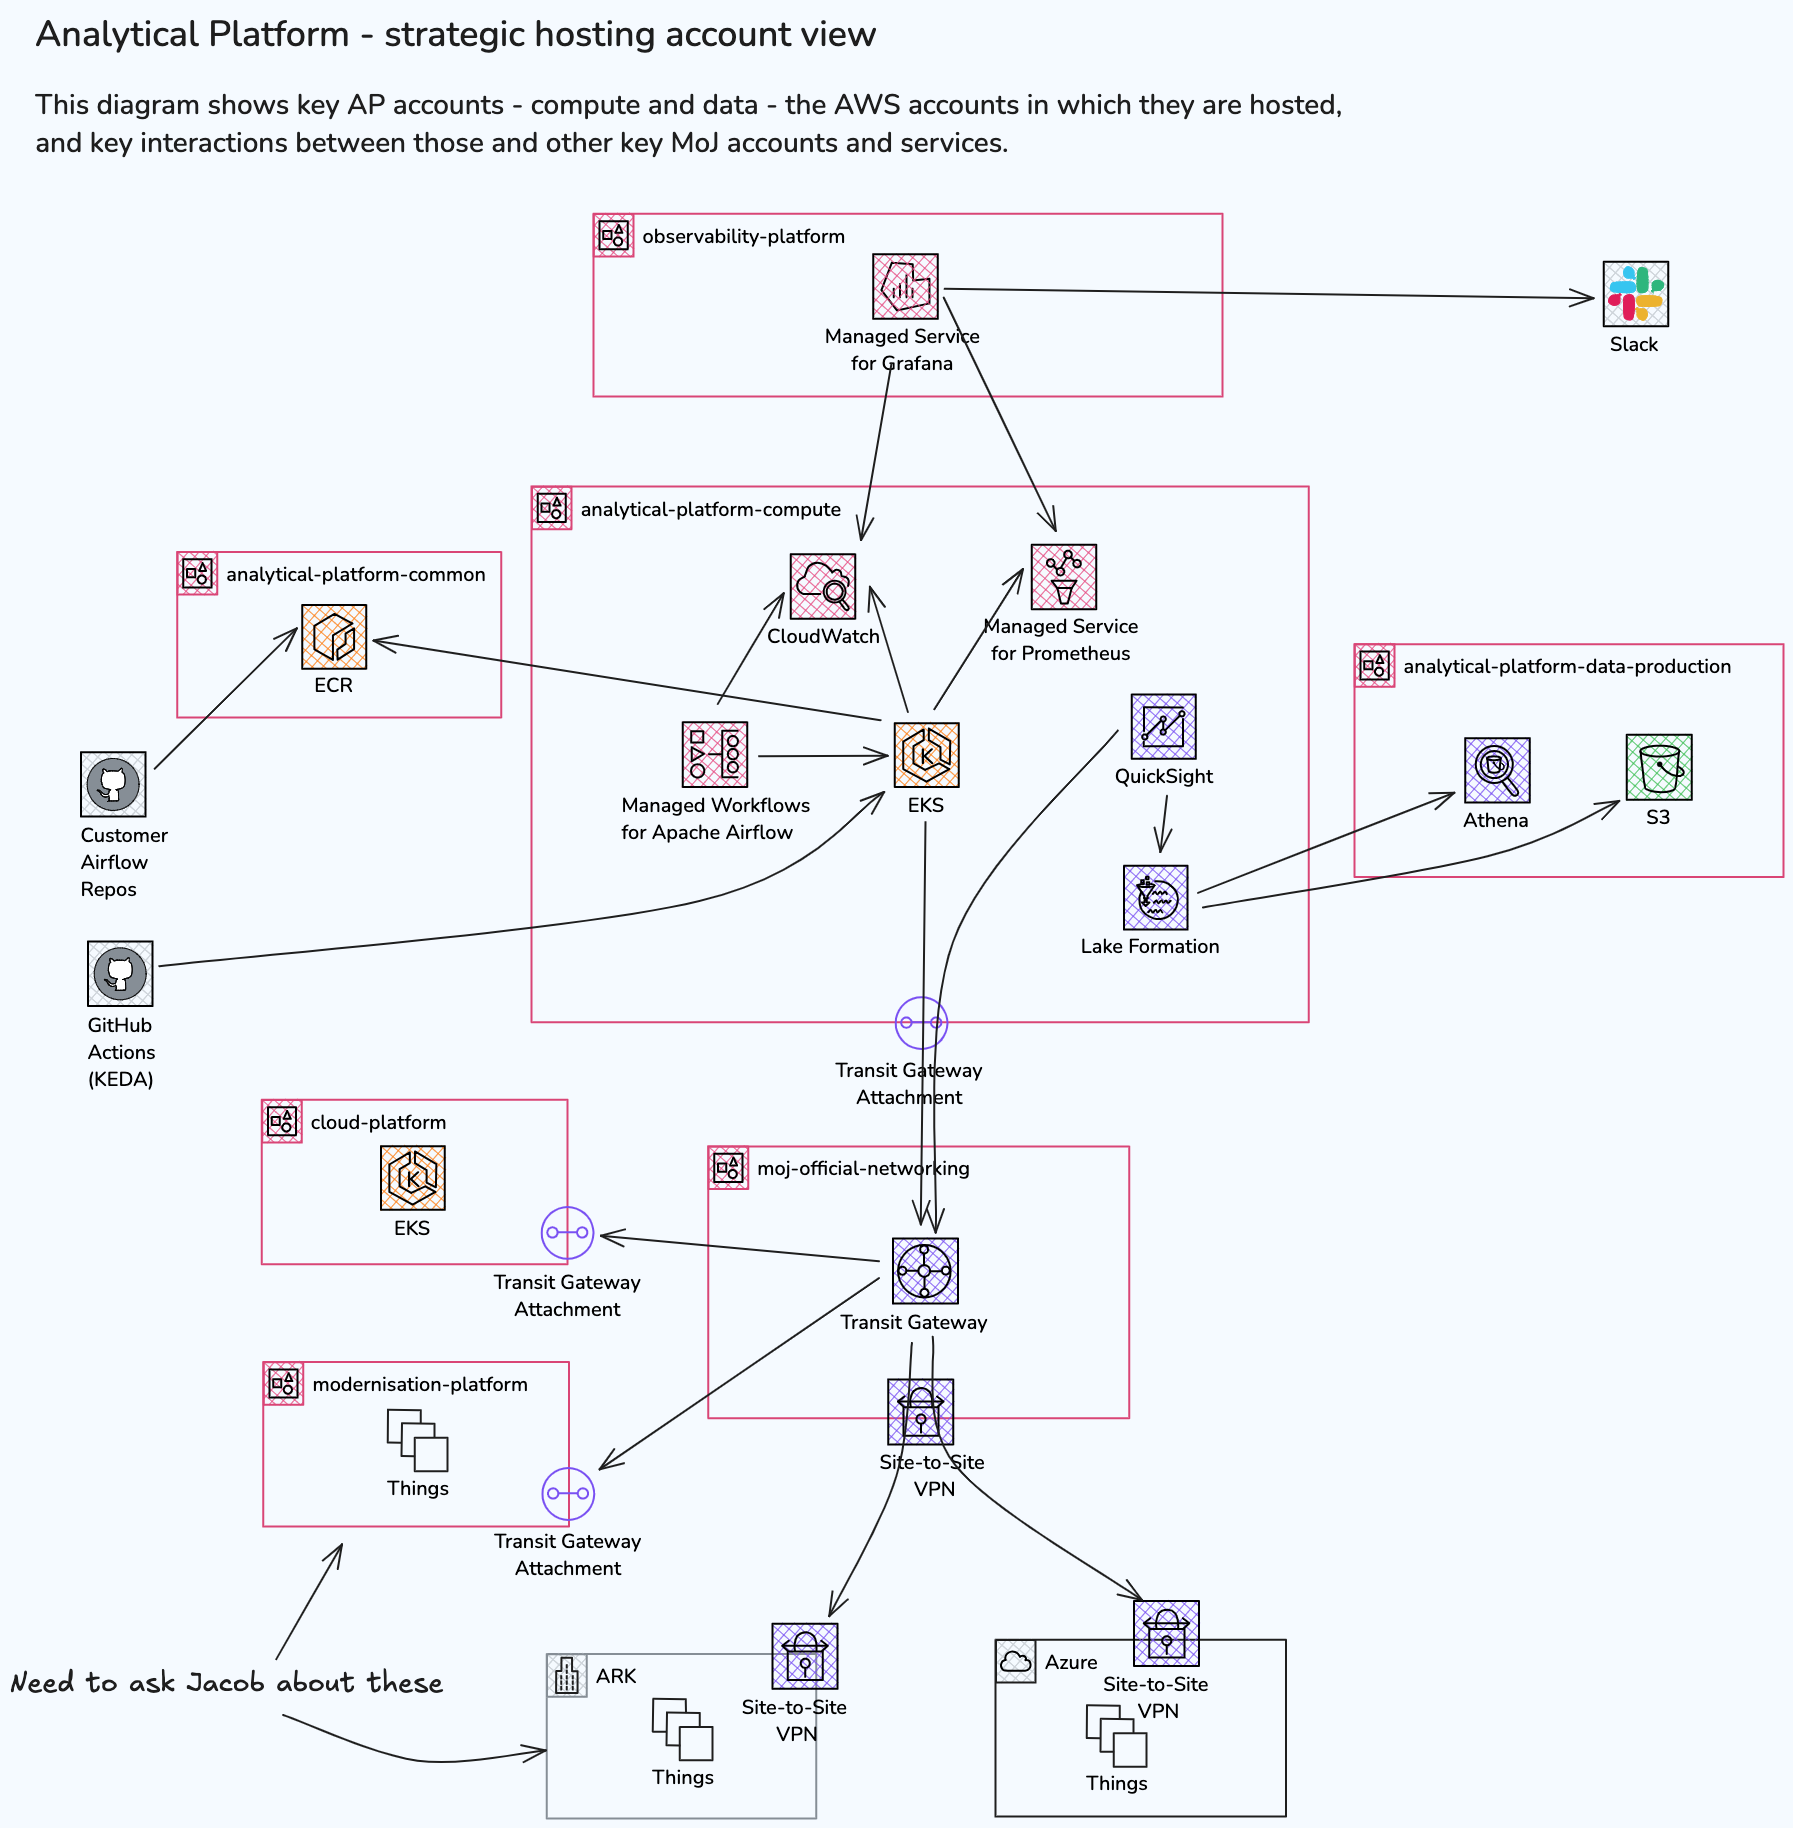
- Analytical Platform data and compute accounts. Shows data and compute accounts (ingestion omitted from this view).
- Analytical Platform ingestion. Shows ingestions services and key interactions with other services (compute omitted from this view).
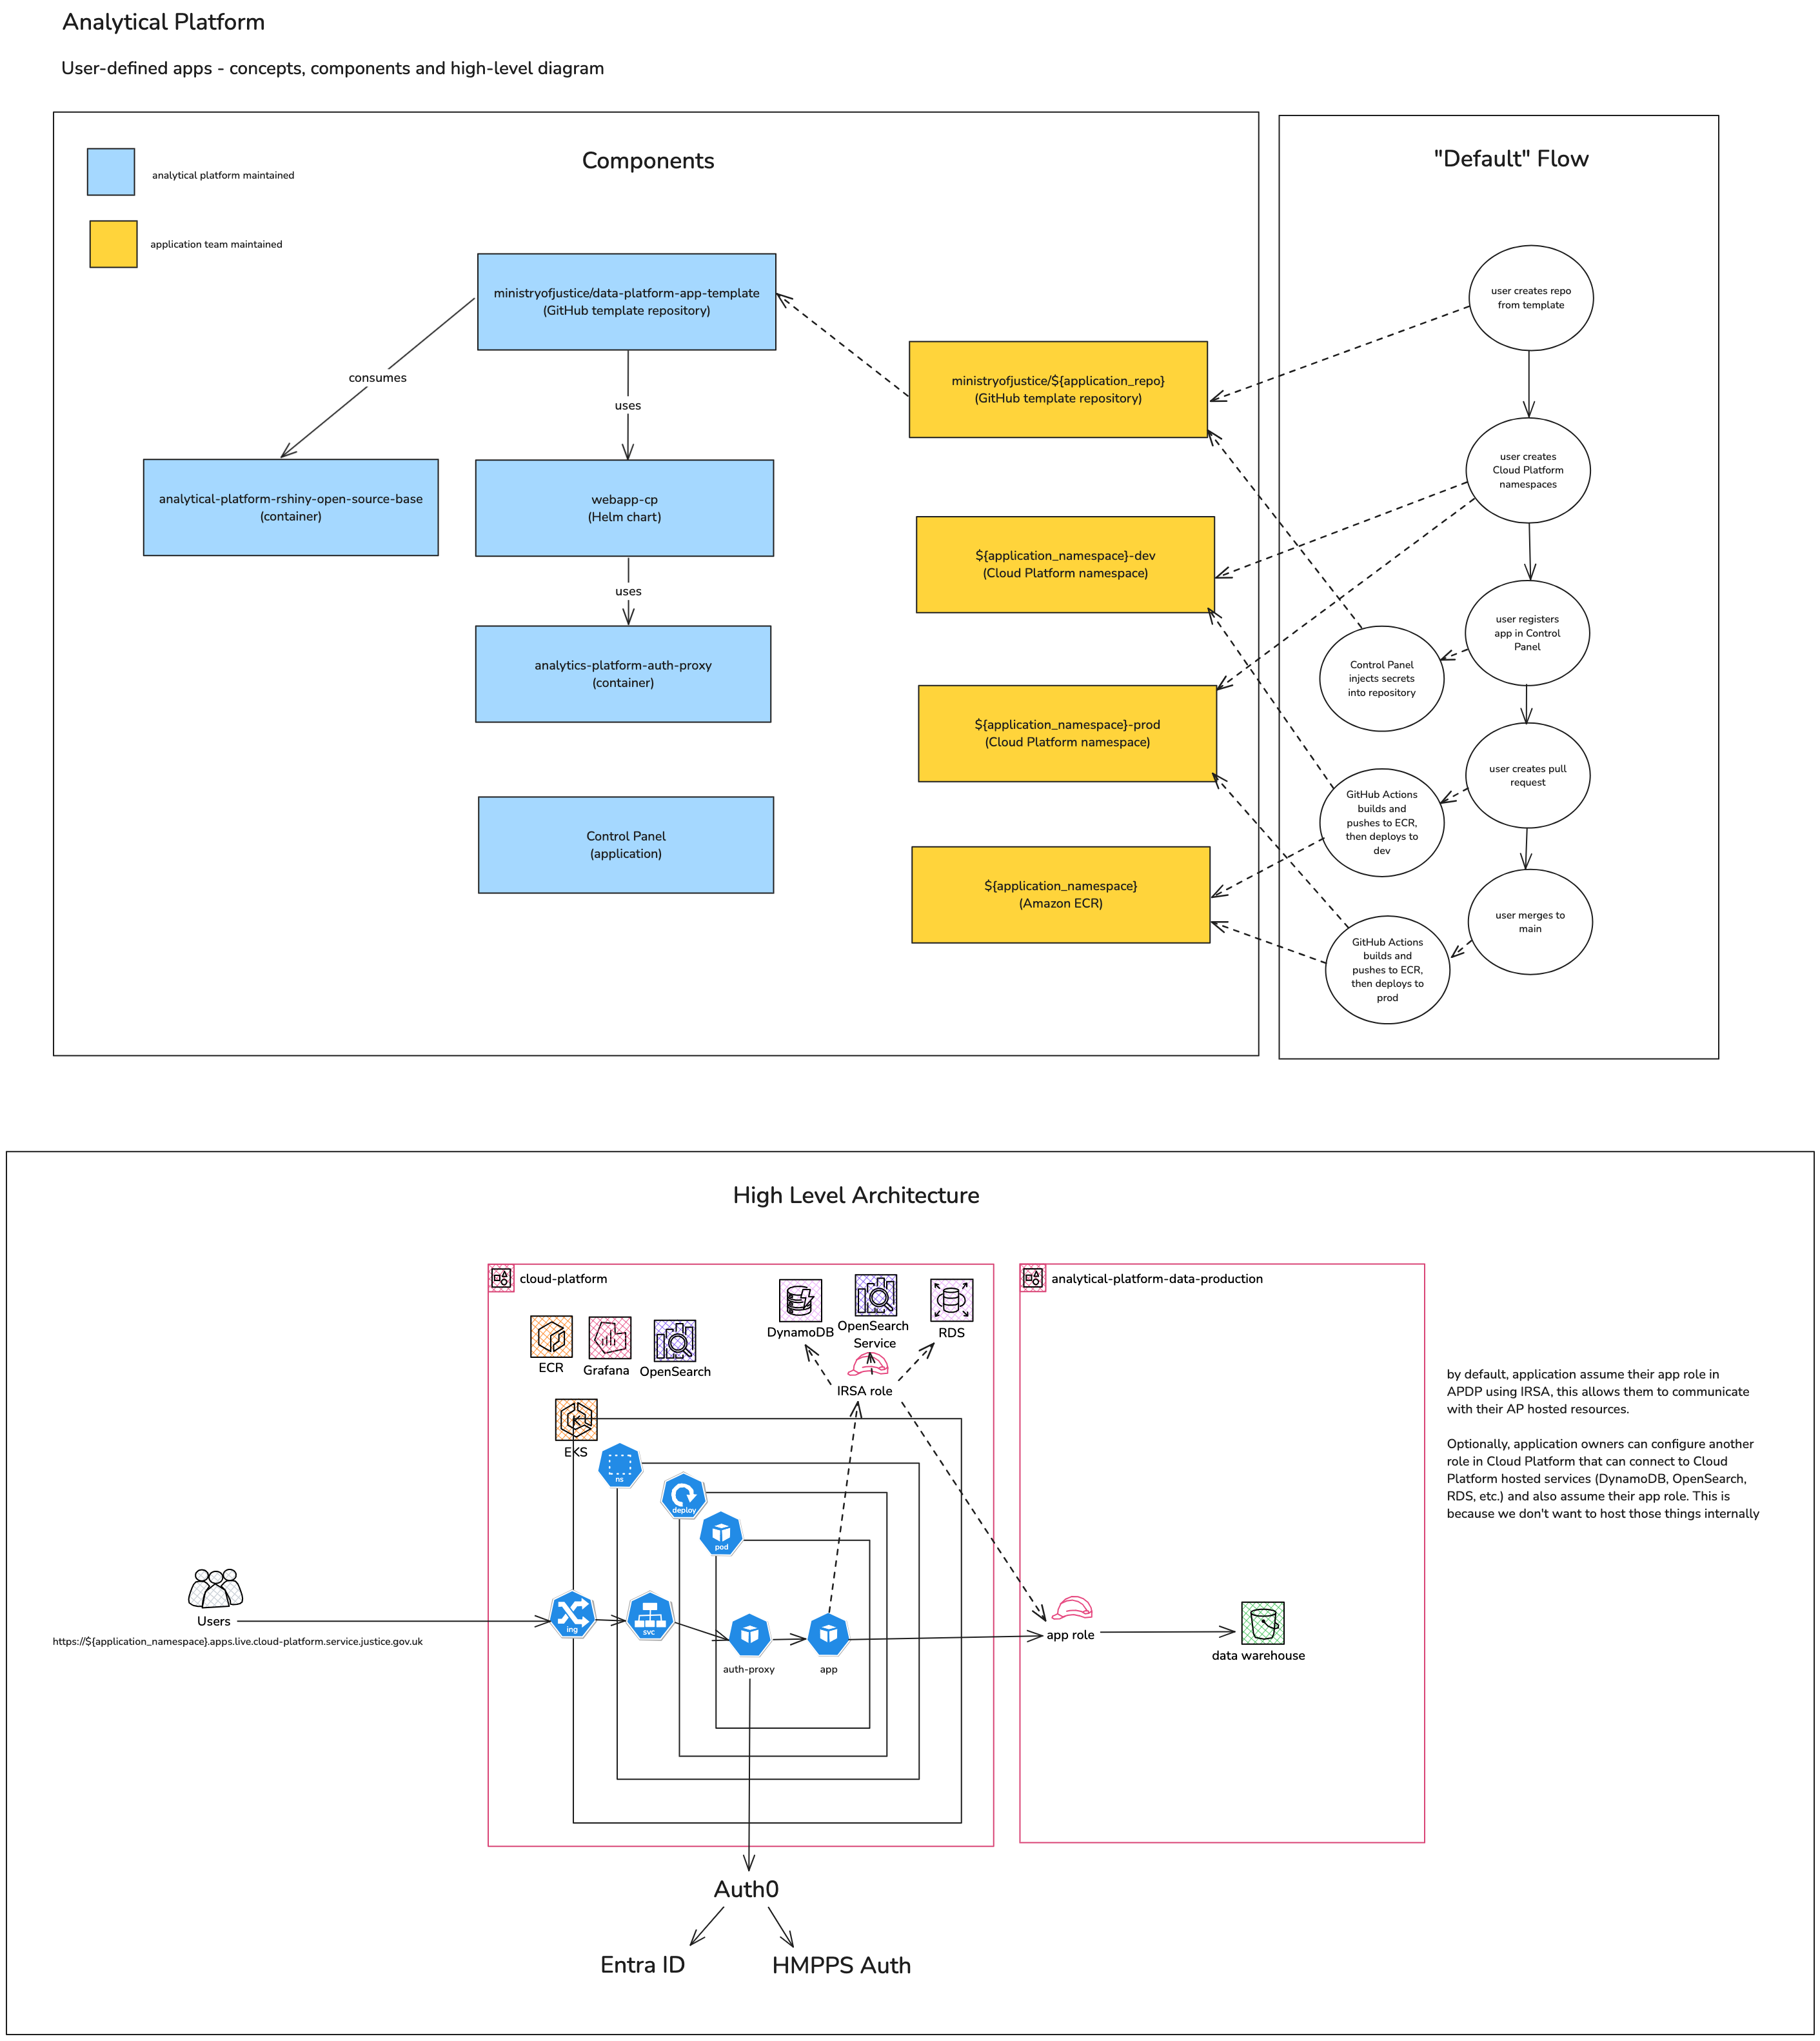
- Apps workflow and HLD. A process flow of how apps are created and deployed, alongside a high-level diagram of services employed.
We also have a collection Wardley maps. The intention was offer a visual framework to understand and plan the evolution of the AP. They help map out system components, their dependencies, and their maturity. These have not been maintained or updated.
Contributing and updating
We created these diagrams using the open source tool Excalidraw. The files have .png appended onto the filename, e.g diagram.excalidraw.png. This allows the editors below to manipulate and version the files without the need to export after every change. It also allows the GitHub user interface to display the diagrams as images.
Excalidraw supports several styles, ranging from “rough sketch” to more formal. When updating or creating diagrams, we ask that diagrams look more formal - i.e. straight clean lines, square corners and the sans-serif font.
This helps some users with readability, and also the “rough sketch” style can appear unprofessional or unfinished to other teams who are more used to diagramming software like draw.io or Visio.
If you would like to edit Excalidraw files, then use one of the following methods.
- In GitHub on the web using vscode.dev with the Excalidraw extension
Recommended for small changes, requires no software.
- Using Visual Studio Code with the Excalidraw extension. Create a branch for your changes, submit a pull request and the approver will see a visual comparsion of your changes. Dev container note:* at the time of writing, the Excalidraw extension does not work in a dev container unless the extension is also installed locally.
Recommended for creating diagrams.
- Using the web version of Excalidraw and opening the the cloned, or downloaded files
Recommended for small group sessions using live collaboration Diagrams created this way can get lost or forgotten, especially if the author moves teams. We recommend once you are happy with the online version, you use Excalidraw’s “download file” feature to add the diagram to this repository. Note that the downloaded file will have a
.excalidrawfile extension. To make it work in VS Code, you need to change the extension to.excalidraw.png(and accept the warning your operating system gives you about changing file extensions).